Missing-data PCA (mdPCA)
Missing-data PCA is useful when genotype matrices are too incomplete for ordinary PCA assumptions. Ancient DNA is a common example: every individual can have sparse coverage, and there may be no fully observed reference individuals. This notebook masks 70% of genotypes at random for every individual, then compares ordinary PCA fallbacks with mdPCA.
Build a structured genotype dataset
The synthetic dataset has 200 individuals and 1,000 SNPs. The population labels are geography-like source groups; all samples, including the reference-like groups, will receive the same random missingness process.
from pathlib import Path

import matplotlib.pyplot as plt
import numpy as np
import pandas as pd
from sklearn.decomposition import PCA as SklearnPCA
from sklearn.metrics import silhouette_score

from snputils import mdPCA
from snputils.datasets import build_synthetic_mdpca_dataset
from snputils.visualization import plot_embedding, scatter

RESULTS_DIR = Path("results/tutorials/mdpca")
RESULTS_DIR.mkdir(parents=True, exist_ok=True)
SEED = 42

dataset = build_synthetic_mdpca_dataset(
    n_samples=200,
    n_snps=1_000,
    seed=SEED,
)
snpobj = dataset["snpobj"]
laiobj = dataset["laiobj"]
labels = dataset["labels"]

print(snpobj)
labels["label"].value_counts().rename_axis("label").reset_index(name="n_samples")
SNPObject(shape=(1000, 200, 2), n_snps=1000, n_samples=200, genotypes_shape=(1000, 200, 2), calldata_lai_shape=(1000, 200, 2), calldata_gp_shape=None, has_variant_metadata=True, has_ancestry_map=True)
| label | n_samples | |
|---|---|---|
| 0 | AFR_ref | 40 |
| 1 | EUR_ref | 40 |
| 2 | EAS_ref | 40 |
| 3 | ADMIXED_AFR_EUR | 40 |
| 4 | ADMIXED_EUR_EAS | 40 |
Mask 70% of every individual
This is missing completely at random across SNPs, samples, and haplotypes.
rng = np.random.default_rng(SEED + 1)
missing_rate = 0.70

incomplete = snpobj.copy()
genotypes = snpobj.genotypes.copy()
missing = rng.random(genotypes.shape) < missing_rate
genotypes[missing] = -1
incomplete.genotypes = genotypes

observed_fraction = (genotypes >= 0).mean(axis=(0, 2))
complete_variant_mask = np.all(genotypes >= 0, axis=(1, 2))

print(f"Mean observed genotype fraction per individual: {observed_fraction.mean():.3f}")
print(f"Range across individuals: {observed_fraction.min():.3f} - {observed_fraction.max():.3f}")
print(f"Complete-case SNPs left for ordinary PCA: {complete_variant_mask.sum()} of {snpobj.n_snps}")
Mean observed genotype fraction per individual: 0.298
Range across individuals: 0.271 - 0.327
Complete-case SNPs left for ordinary PCA: 0 of 1000
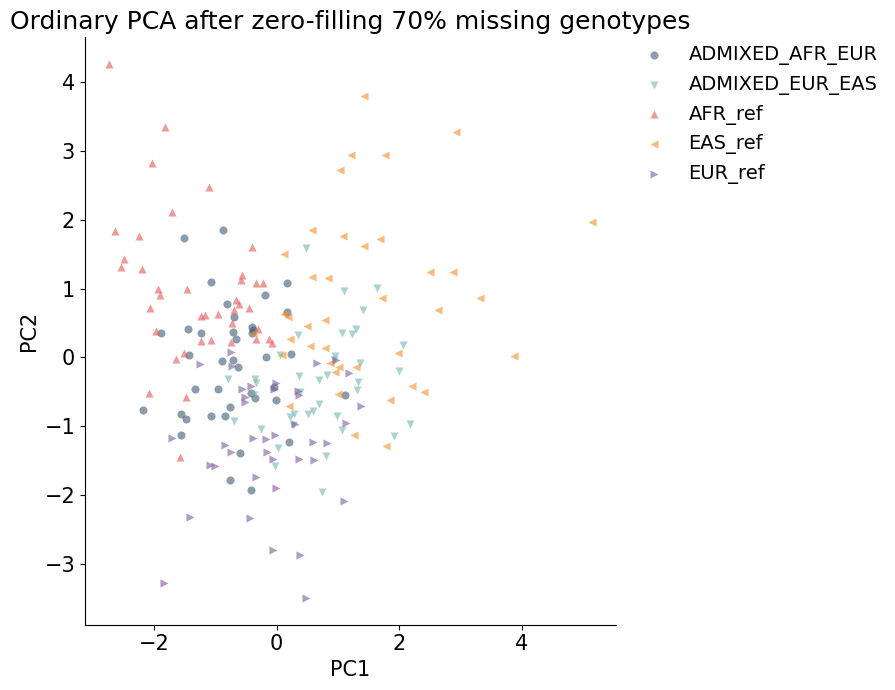
Ordinary PCA fallback: zero-filled missing calls
Complete-case PCA has no SNPs left. A common but poor fallback is to fill missing genotypes with a fixed value and run ordinary PCA. Here missing diploid dosages are filled with 0, which strongly weakens the population structure.
def dosage_matrix(snp):
    gt = snp.genotypes
    dosage = gt.sum(axis=2).astype(float)
    dosage[np.any(gt < 0, axis=2)] = np.nan
    return dosage.T  # samples x SNPs

X_missing = dosage_matrix(incomplete)
X_zero_filled = np.nan_to_num(X_missing, nan=0.0)

ordinary_coords = SklearnPCA(n_components=2, random_state=SEED).fit_transform(X_zero_filled)
ordinary_df = labels.copy()
ordinary_df["PC1"] = ordinary_coords[:, 0]
ordinary_df["PC2"] = ordinary_coords[:, 1]

ordinary_silhouette = silhouette_score(ordinary_coords, ordinary_df["label"])
print(f"Population-label silhouette after zero-filled PCA: {ordinary_silhouette:.3f}")

plot_embedding(ordinary_df, hue="label", title="Ordinary PCA after zero-filling 70% missing genotypes")
plt.show()
Population-label silhouette after zero-filled PCA: 0.003
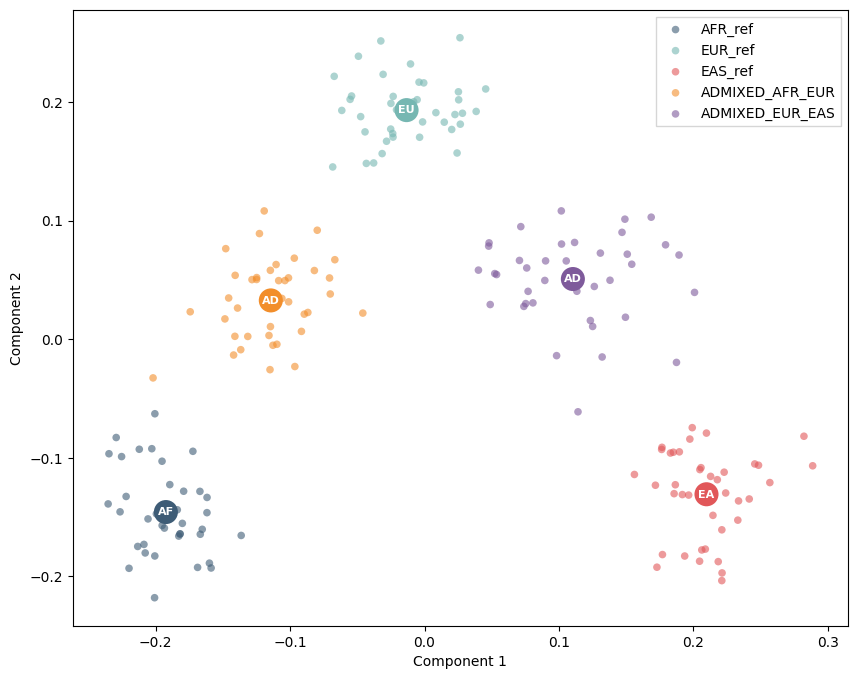
mdPCA on the same incomplete matrix
mdPCA computes the covariance structure while respecting missing values. Here is_masked=False means the example is about missing genotypes themselves, not ancestry-specific masking. Every individual still has about 70% missing calls.
mdpca = mdPCA(
    snpobj=incomplete,
    laiobj=laiobj,
    labels=labels,
    ancestry=1,
    is_masked=False,
    average_strands=True,
    min_percent_snps=1,
    group_snp_frequencies_only=False,
    n_components=2,
)

mdpca_silhouette = silhouette_score(mdpca.X_new_, labels["label"])
print(f"Population-label silhouette after mdPCA: {mdpca_silhouette:.3f}")
print("mdPCA embedding shape:", mdpca.X_new_.shape)
Population-label silhouette after mdPCA: 0.675
mdPCA embedding shape: (200, 2)
scatter(mdpca, labels)
plt.show()