Visualization
Plotting helpers live under the snputils.viz namespace (an alias for snputils.visualization). All examples below use su.viz; the same functions are importable directly from snputils.visualization.
import snputils as su
Scatter Plot (PCA / MDS)
# pca is a fitted PCA, mdPCA, or maasMDS instance with X_new_ and samples_
su.viz.scatter(
    pca,
    "labels.tsv",                        # or a DataFrame from read_labels
    label_mode="arrow",                  # 'legend', 'acronym', 'arrow'
    save_path="pca.pdf",
    equal_aspect=True,
)
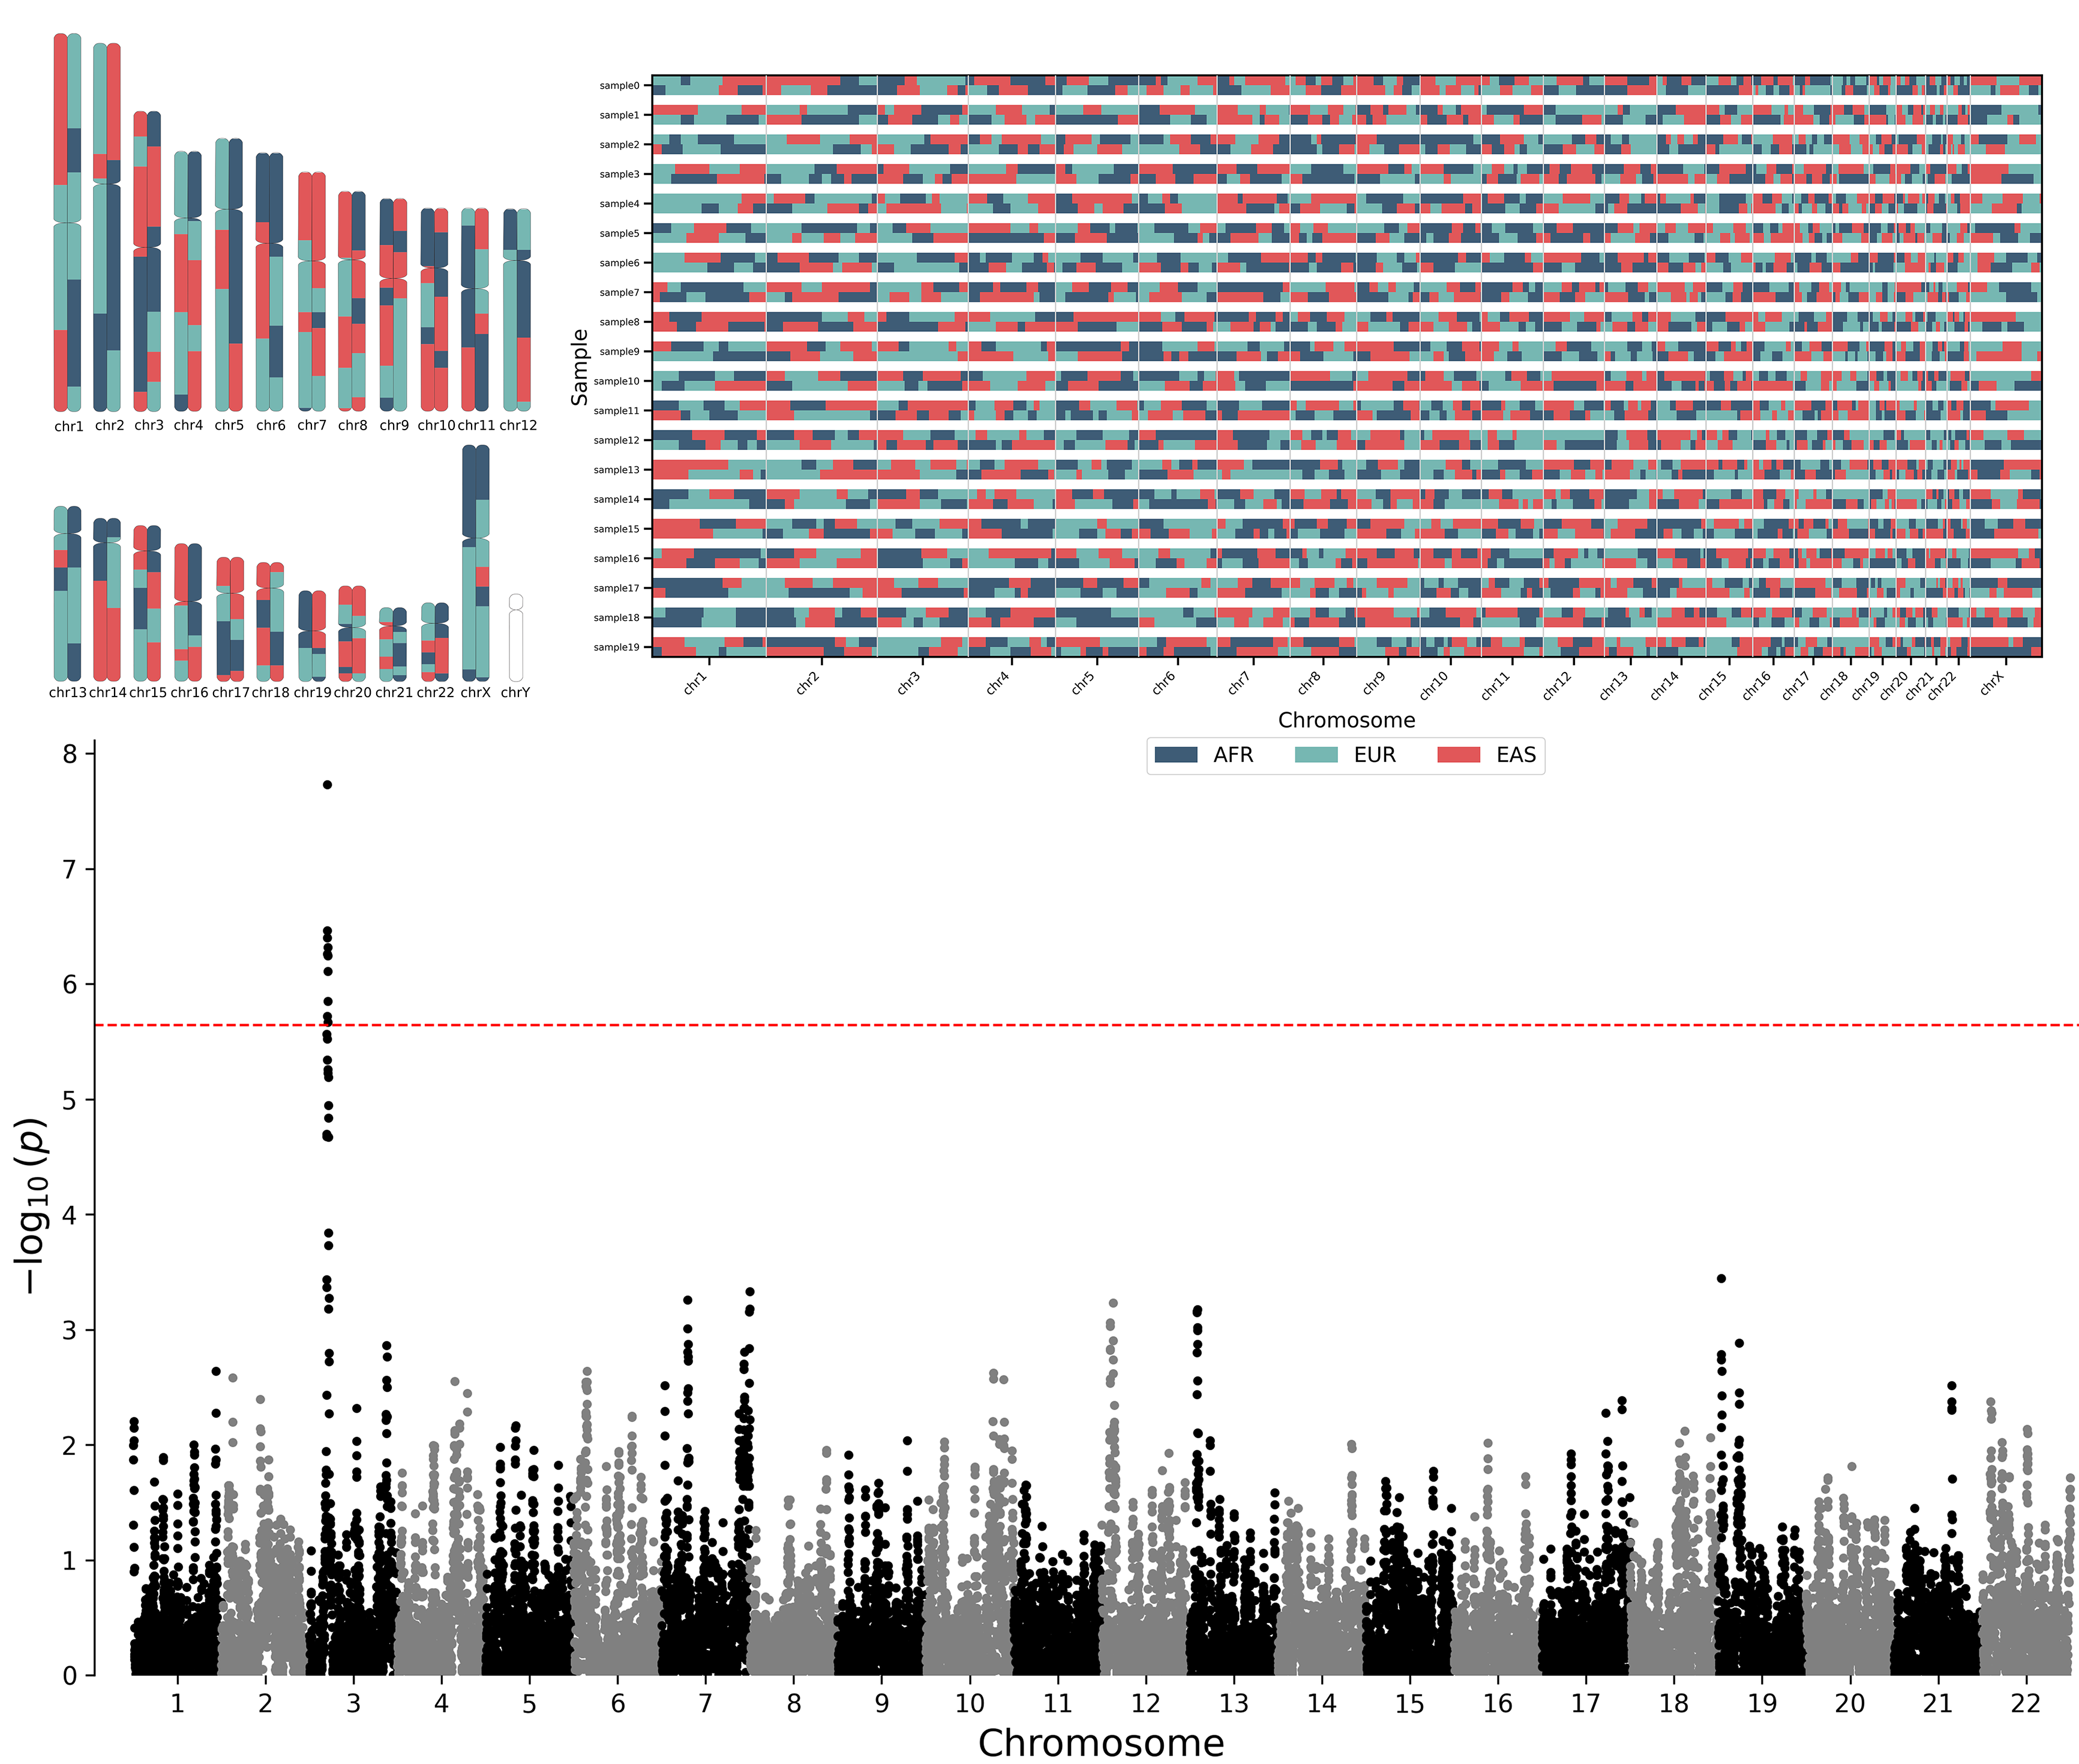
Dataset-Level LAI Plot
Raster plot where each row is a sample (maternal + paternal haplotypes) and each column is a genomic window.
colors = {0: "steelblue", 1: "tomato", 2: "gold"}

su.viz.plot_lai(
    laiobj=laiobj,
    colors=colors,
    legend=True,
    title="Local Ancestry",
)
Chromosome Painting
Per-sample chromosome paintings over the full genome. Accepts a LocalAncestryObject, MSP file(s), or pre-formatted BED files.
su.viz.chromosome_painting(
    source=laiobj,                 # or "file.msp" or ["chr1.msp", "chr2.msp"]
    output_dir="paintings/",
    sample_id=None,                # None → all samples; str or list for subset
    build="hg38",                  # or 'hg37'
    color_map=None,                # None → default palette; dict or TSV path
    output_format="png",           # or 'pdf'
)
Admixture Bar Chart
import matplotlib.pyplot as plt

fig, ax = plt.subplots()
Q_sorted, _, boundaries, _ = su.viz.reorder_admixture(admobj.Q)
su.viz.plot_admixture(
    ax=ax,
    Q_mat_sorted=Q_sorted,
    boundary_list=boundaries,
)
Multiple ADMIXTURE runs at different K values can be visualized together with pong_viz:
su.viz.pong_viz(
    folder_runs="admixture_runs/",
    output_dir="pong_out/",
    min_k=3, max_k=8,
    ind2pop_path="ind2pop.txt",
    pop_names_path="pop_names.txt",
)
Manhattan and QQ Plots
su.viz.manhattan_plot(
    data=gwas_results,               # DataFrame or path with chrom, pos, p columns
    significance_threshold=5e-8,
    title="GWAS Manhattan",
    save_path="manhattan.png",
)

su.viz.qq_plot(
    data=gwas_results,
    save_path="qq.png",
)
Via CLI:
snputils plot-manhattan --results-path gwas.tsv.gz --output-path manhattan.png
snputils plot-qq        --results-path gwas.tsv.gz --output-path qq.png
Function reference: Visualization.